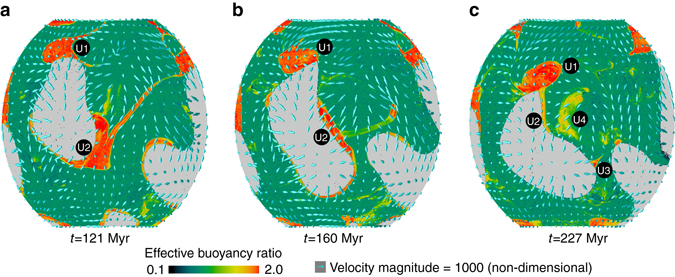
Fig. 4.

Time evolution of the location and morphology of ultradense material patches. a–c Composition field (represented by effective buoyancy ratio) at 5 km above the CMB showing locations of ultradense material (reddish) and pile material (greenish). The yellowish color shows a mixing of ultradense material with pile material. The cyan arrows show mantle flow velocity. U1, U2, U3, and U4 are markers that track the patches of ultradense material, as explained in the text. Light gray color represents Earth’s core
