
Fig. 5.
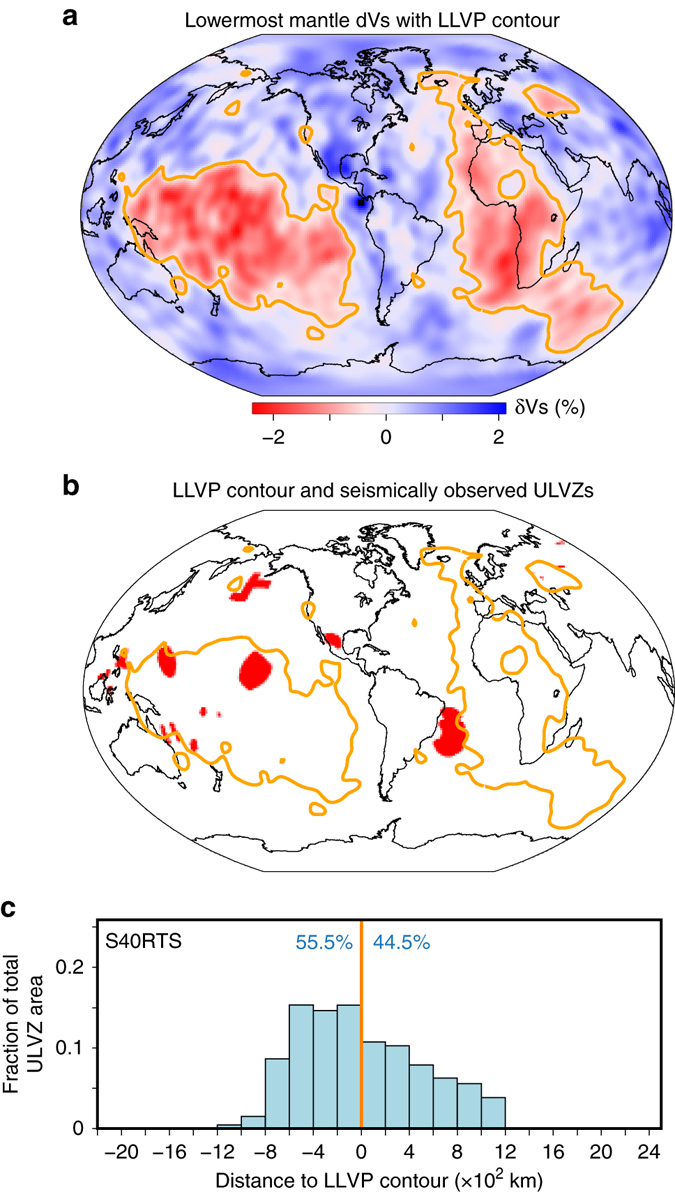
Seismic observation of ULVZs and LLVP edges. a Seismic shear-wave tomography model at 2800 km depth (S40RTS), with the LLVP edges shown by orange lines that surround 30% of the CMB area. b LLVP edges (orange lines) along with the ULVZ Fresnel zone patches (red, discretized in 0.5 × 0.5 degree cells) for all ULVZ waveform studies of core reflected waves (ScS, ScP, PcP). c The minimum distance of every ULVZ cell to LLVP edges. For each distance in the horizontal axis, the corresponding vertical axis shows the areal fraction of total ULVZ area. The thick orange line denotes the LLVP margin. Negative distance represents outside of LLVPs and positive distance represents inside of LLVPs. The percent area outside vs. inside of LLVPs is indicated by the blue text