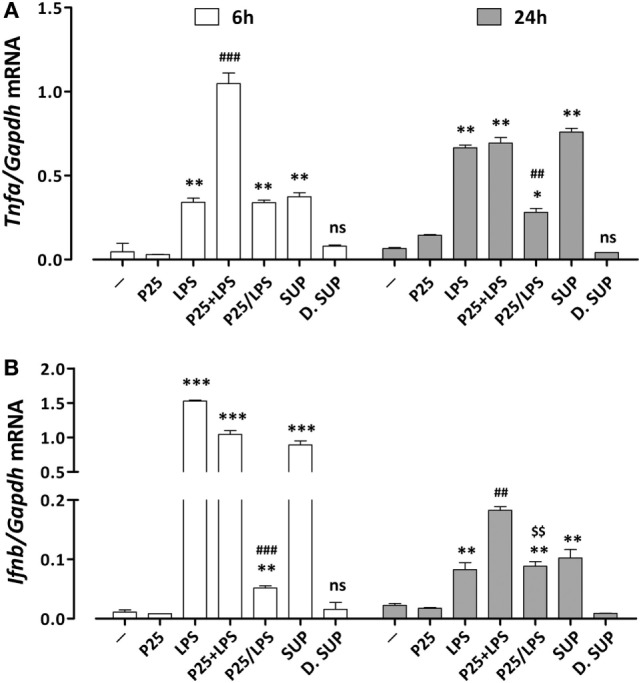
Figure 4.

Assessment of the pro-inflammatory gene response elicited by P25/lipopolysaccharide (LPS) in macrophages. mRNA expression levels of Tnfa (A) and Ifnb (B) were assessed in Raw264.7 cells after 6 and 24 h of exposure to the indicated experimental conditions (see legend to Figure 2 for details). Control cells (−) were incubated in plain serum-supplemented medium. Data are means of two (for Tnfa) or three (for Ifnb) independent experiments each performed in duplicate with SD shown. *, **, *** p < 0.05, p < 0.01, p < 0.001 vs. cells treated with P25 at the same experimental time; ##, ###, p < 0.01, p < 0.001 vs. cells treated with LPS at the same experimental time; $$, p < 0.01 vs. cells treated with P25/LPS at 6 h, as evaluated by two-tailed t-test for unpaired data.
