Figure 3.

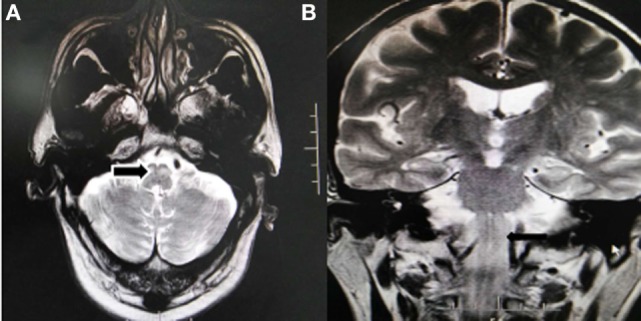
1.5T Brain MRI, axial T2-weighted images (A) and coronal T2-weighted images (B) shows the symmetric enlargement and increased signal intensity of both inferior olives (arrow).

1.5T Brain MRI, axial T2-weighted images (A) and coronal T2-weighted images (B) shows the symmetric enlargement and increased signal intensity of both inferior olives (arrow).