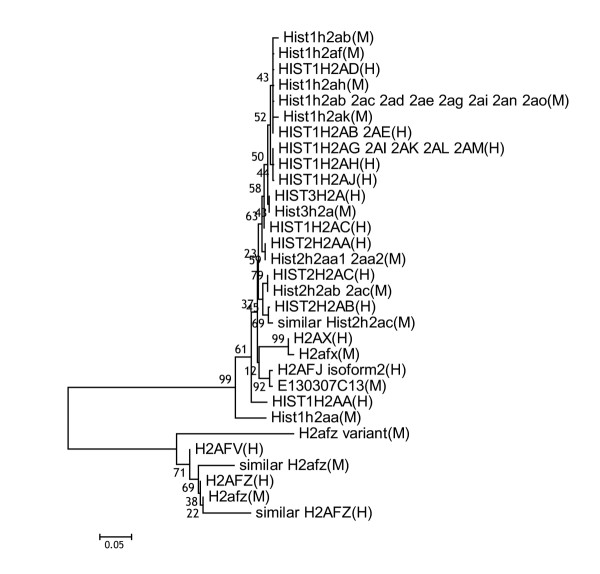
Figure 1.
Phylogenetic relationships among 44 amino acids sequences from human and mouse histone H2a related proteins. The bar indicates 5% difference of sequence. The numbers at the branches indicate percentage of 1000 bootstrap analyses. (H) and (M) indicate the human sequence and mouse sequence, respectively.

