Figure 2.

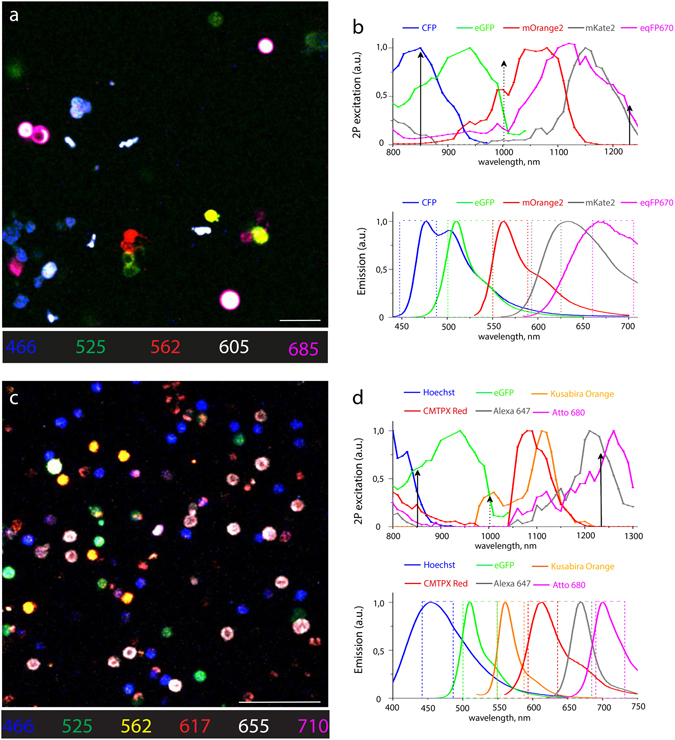
In vitro spectrally multiplexed imaging of five fluorescent proteins in HEK cells and six chromophores in murine splenocytes. (a) Raw fluorescence image of a mixture of HEK cells singly expressing one of five FPs: CFP, eGFP, mOrange2, mKate2, and eqFP670. (b) Two-photon excitation and emission spectra of CFP, eGFP, mOrange2, mKate2, and eqFP670. Two-photon spectra of mOrange2, mKate2, and eqFP670 were recorded in this work (Methods). Arrows indicate effective excitation wavelengths and rectangles indicate the filter bandwidth of the five detection channels (a.u., arbitrary units). (c) Raw image of a mixture of murine splenocytes each labelled with one of six fluorophores: Hoechst, eGFP, Kusabira Orange, CMTPX Red, Alexa 647, and Atto 680. (d) Two-photon excitation and emission spectra of Hoechst, eGFP, Kusabira Orange, CMTPX Red, Alexa 647, and Atto 680. 2P spectra of Hoechst, Kusabira Orange, CMTPX Red, Alexa 647, and Atto 680 were recorded (Methods). Arrows indicate optimal excitation wavelengths and rectangles indicate the filter bandwidth of the six detection channels (a.u., arbitrary units). Scale bars, 50 μm.
