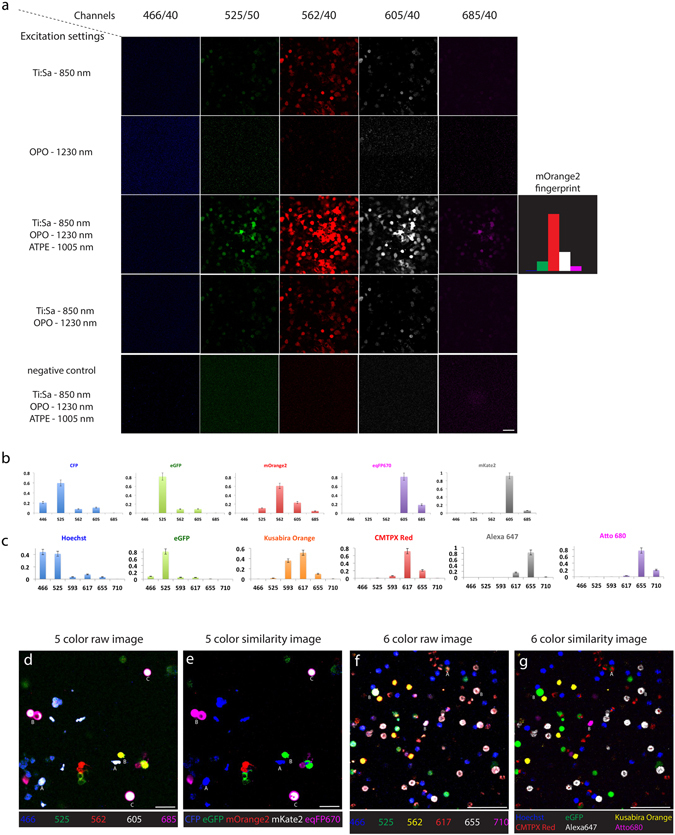
Figure 4.

Similarity unmixing of spectrally multiplexed images of isolated cells. (a) Single color measurement of HEK cells expressing only mOrange2. Rows represent four excitation schemes: single 2P excitation at 850 nm by Ti:Sa laser; single 2P excitation at 1230 nm by OPO; the wavelength mixing 2P excitation at 850 nm, 1005 nm and 1230 nm by Ti:Sa laser, ATPE and OPO laser, respectively; dual unsynchronized 2P excitation at 850 nm and 1230 nm by Ti:Sa and OPO, respectively. The columns display images from five detection channels. The elements of the fingerprints are calculated as average signal values at the wavelength mixing scheme. (b) The fingerprints of five FPs, CFP, eGFP, mOrange2, mKate2, and eqFP670. (c) The fingerprints of six fluorophores, Hoechst, eGFP, Kusabira Orange, CMTPX Red, Alexa 647, and Atto 680. (d,e) Raw and unmixed images of HEK cell mixture expressing one of five FPs. Letter A indicates example of the crosstalk of the overexpressed signal from minimal spectrally overlapped FPs (case I and II cells in Fig. 3). Letter B indicates example of the crosstalk from strong spectral overlap (case III and IV in Fig. 3). Letter C indicates example of both crosstalk effects, signal overexpression and strong spectral overlapping. (f,g) Raw and unmixed images of splenocyte mixture expressing six fluorophores at one-fluorophore-per-cell condition. Letter A indicates example of the crosstalk of the overexpressed signal from minimal spectrally overlapped fluorophores (case I and II cells in Fig. 3). Letter B indicates example of the crosstalk from strong spectral overlap (case III and IV in Fig. 3). Scale bars, 50 μm.
