Figure 7.

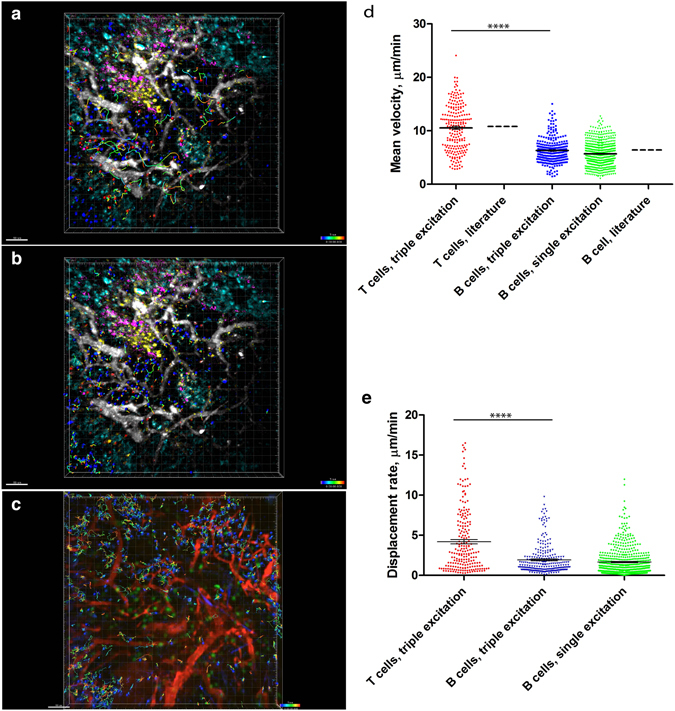
Naïve B and T helper cell motility patterns are similar in conventional and multiplex in vivo imaging, respectively, during GC reactions. (a,b) SIMI-unmixed time-lapsed 3D fluorescence images (500 × 500 × 40 µm³) as described in Fig. 6, with tracked CD4+ T and naïve B cells. The cell tracks are depicted as rainbow colored lines. We performed triple two-photon excitation at 850 nm (Ti:Sa), 1230 nm (OPO) and virtually at 1005 nm. (c) Time-lapsed 3D fluorescence images (500 × 500 × 30 µm³) in the lymph node of an anesthetized mouse, at day 7 after NP-CGG immunization. Naïve B cells labelled by Hoechst are depicted in blue, B1-8 GFP cells (GCs cells) are depicted in green and blood vessels labeled by rhodamine-dextran are shown in red. In this case, we performed a single two-photon excitation at 930 nm (Ti:Sa). Mean velocity distribution (d) and the displacement rate (e) of naïve B- and T helper cells, respectively, is significantly different, as previously reported. The absolute values of the mean velocity of both naïve B cells and T cells match the published values for B and T cell velocities9, depicted in graph (d). Additionally, both the mean velocity and the displacement rate of naïve B cells after triple two-photon excitation (with Ti:Sa and OPO), obtained from (a,b), are the same as the values measured after single two-photon excitation (with only Ti:Sa), obtained from (c), as indicated in the graphs (d) and (e). Mann-Whitney non-parametric tests were used for statistical analysis of the data. (*p < 0.05, **p < 0.01, ***p < 0.001, ****p < 0.0001). Scale bars, 50 μm.
