
Fig. 1.
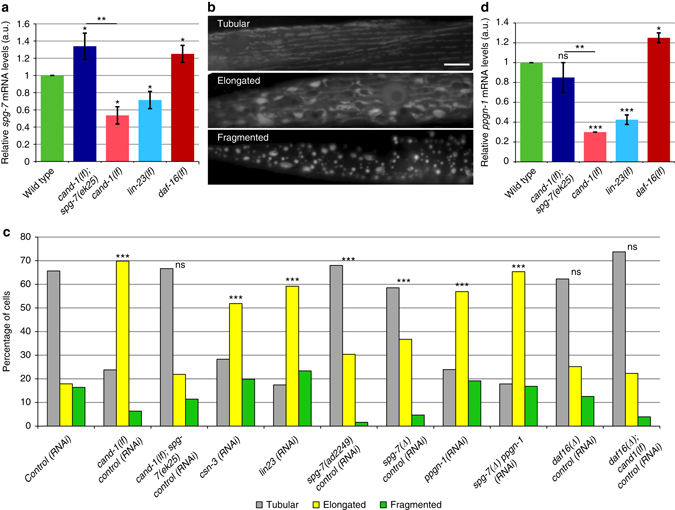
CAND-1/SCFLIN-23 regulates mitochondrial shape via spg-7 and ppgn-1. a Real-time PCR quantification of spg-7 mRNA levels in adults of the indicated genotypes, presented in arbitrary units (a.u.) normalized to control rpl-19 (ribosomal protein L19) mRNA. Error bars denote s.e.m. from four biological replicates, each with at least two technical replicates. P values were determined by Student’s t-test. b Images of tubular, elongated, and fragmented mitochondria visualized by mitochondria-targeted GFP expressed in body-wall muscle cells. Scale bar, 10 µm. c The percentages of muscle cells with tubular, elongated, and fragmented mitochondria for the indicated genotypes and RNAi treatments. All animals were fed either gene-specific RNAi or control RNAi so that the feeding conditions were matched. P values were determined by χ 2-test. Sample size (n) of muscle cells from left to right are: 729; 126; 210; 124, 210; 201; 234; 274; 209; 297; 318; 457. Mitochondrial morphology was scored blinded. d Real-time PCR quantification of ppgn-1 mRNA levels normalized to control rpl-19 mRNA in adults of the indicated genotypes. Error bars denote s.e.m. from three biological replicates, each with at least two technical replicates. P values determined by Student’s t-test. For all panels, asterisks above bars denote P value comparisons to wild-type/controls; asterisks above lines denote comparisons under the lines: *P < 0.05; **P < 0.01; ***P < 0.001; ns = not significant