Fig. 10.

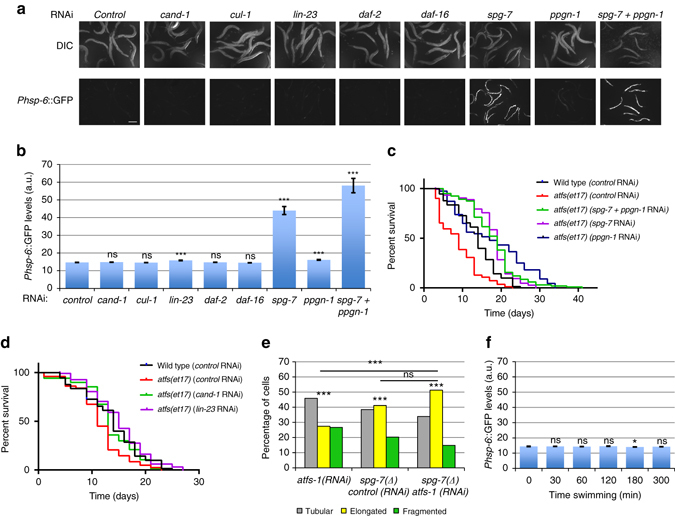
The UPRmt is not involved in the mitochondrial fusion pathway. a Representative images of the UPRmt marker Phsp-6::GFP in L4/young-adult-stage animals for the indicated RNAi treatments. Scale bar, 200 µm. b Quantification of Phsp-6::GFP signal for the RNAi treatments shown in a for 20 animals. Error bars denote s.e.m. P values were determined by Student’s t-test. c, d Survival curves for atfs-1(et17) gain-of-function mutants with the indicated RNAi treatments; the wild-type survival curve is shown in both graphs for comparison. e The percentages of body-wall muscle cells with tubular, elongated, and fragmented mitochondria in the indicated genotypes and RNAi treatments. P values were determined by χ 2-test. Sample size (n) of muscle cells from left to right are: 427; 234; 333. f Quantification of Phsp-6::GFP signal for 20 animals swimming for the indicated times. Error bars denote s.e.m. P values determined by Student’s t-test. The quantification was performed as for b and the two graphs can be compared directly. No significant differences in Phsp-6::GFP were observed relative to 0 min control animals. For all panels, asterisks above bars denote P value comparisons to wild type/controls; asterisks above lines denote comparisons under the lines: *P < 0.05; **P < 0.01; ***P < 0.001; ns = not significant
