
Fig. 8.
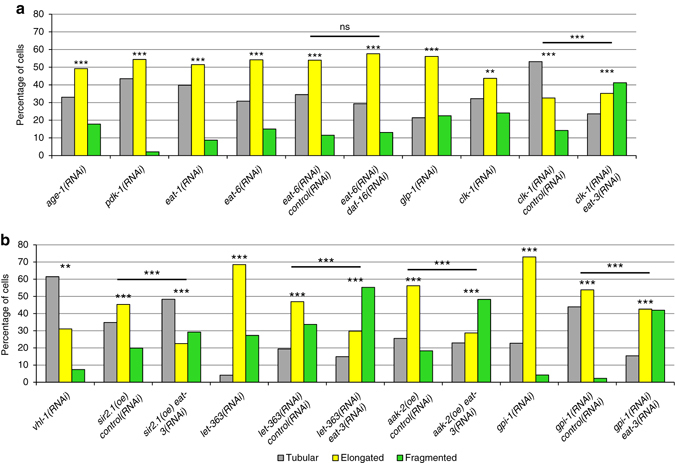
Diverse life extension pathways have increased levels of elongated mitochondria. a, b The percentages of body-wall muscle cells with tubular, elongated, and fragmented mitochondria in the indicated genotypes, overexpression (oe), and RNAi treatments. P values were determined by χ 2-test. Sample size (n) of muscle cells from left to right are: a 254, 239, 301, 331, 103, 110, 303, 270, 141, 148; and b 148, 181, 120, 121, 98, 114, 153, 122, 260, 264, 143. For all panels, asterisks above bars denote P value comparisons to wild-type/control; asterisks above lines denote comparisons under the lines: *P < 0.05; **P < 0.01; ***P < 0.001; ns = not significant