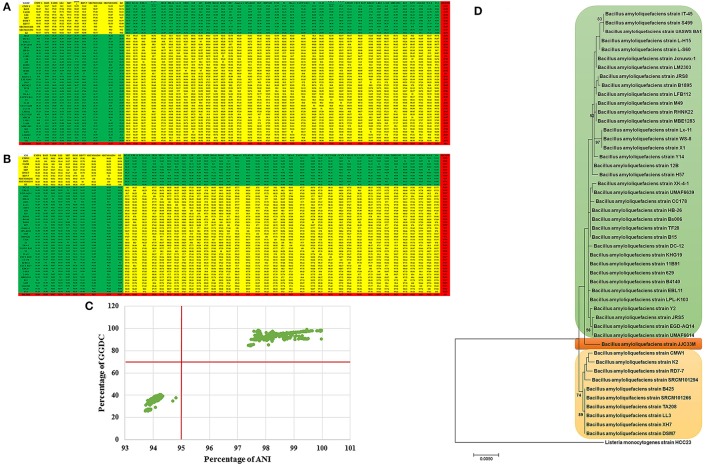
Figure 1.
(A,B) Genome-to-Genome Distance Calculation (GGDC) and Average nucleotide identity (ANI) values between each indicated strains were calculated with GGDC 2 and EzBiocloud web-based programs showed 3 species candidates based on 70% and 95% similarity thresholds. (C) Scatter plot of ANI and GGDC values of B. amyloliquefaciens strains. (D) Maximum Likelihood phylogenomic tree of G-positive bacteria B. amyloliquefaciens strains. L. monocytogenes strain HCC23 was used as outgroup. Supports for branches were assessed by bootstrap resampling of the data set with 1,000 replications.

