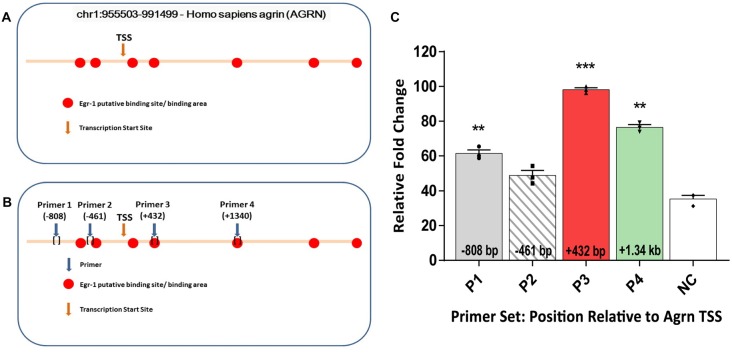
Figure 1.
(A) In-silico analysis of human AGRN on chromosome 1 using the UCSC Genome Browser and Qiagen D-Code program identified several putative early growth response-1 (Egr-1) binding sites on the AGRN gene locus, both upstream and downstream of the TSS. (B) Primers were designed encompassing the putative binding sites, and four specific primer sets were used to amplify parts of the AGRN gene. (C) Chromatin immunoprecipitation (ChIP) assay was performed using these primer sets, and the Egr-1-AGRN interaction was determined using quantitative real time polymerase chain reaction (qPCR). Primers (P) 1, 3 and 4 showed binding activity, with the highest at region P3. Data was calculated as relative fold change, with the highest value set to 100. All results were normalized to internal levels of IgG and plotted relative to the binding activity of the negative control (NC) region from chromosome 1. n = 3. p-values were obtained using Student’s t-tests. *(p ≤ 0.05); **(p ≤ 0.01); ***(p ≤ 0.001); ****(p ≤ 0.0001).

