Figure 6.
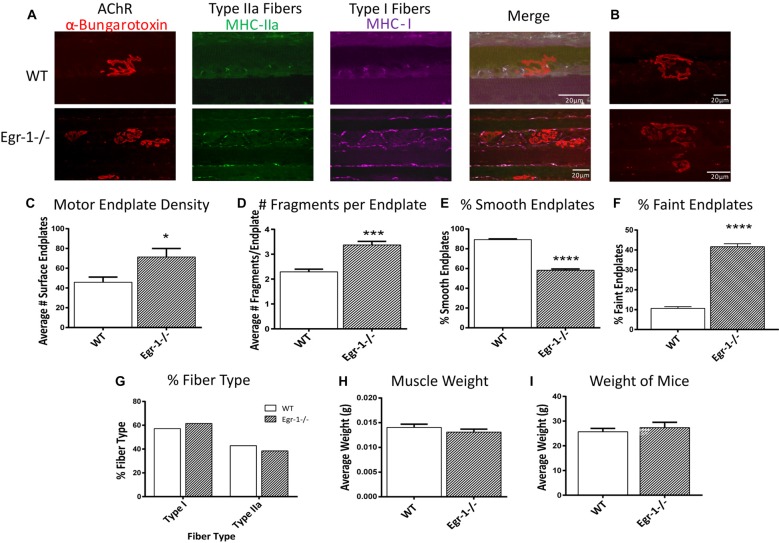
(A,B) Representative stacked confocal images of neuromuscular junctions (NMJs) from five WT and five Egr-1−/− mice soleus muscle NMJs. Soleus muscle preparations from WT and Egr-1−/− mice were labeled with anti-myosin heavy chain (anti-MHC) monoclonal antibodies to view Type I fibers (MHC-I; magenta), type IIa fibers (MHC-IIa; green), and then stained with α-bungarotoxin. n = 5. The mean number of surface endplates, (C) and NMJ fragments, (D) were increased in Egr-1−/− mice compared to WT. The % of smooth endplates (E) was decreased, and the % of faint NMJs was increased (F) in Egr-1−/− mouse soleus NMJs compared to WT. In WT vs. Egr-1−/− mice, there was no significant difference in the % of type I and type IIa soleus muscle fibers, (G) the weight of the soleus muscle, (H) or the overall bodyweight of the mice, (I) p-values were obtained using Student’s t-tests. *(p ≤ 0.05); **(p ≤ 0.01); ***(p ≤ 0.001); ****(p ≤ 0.0001).

