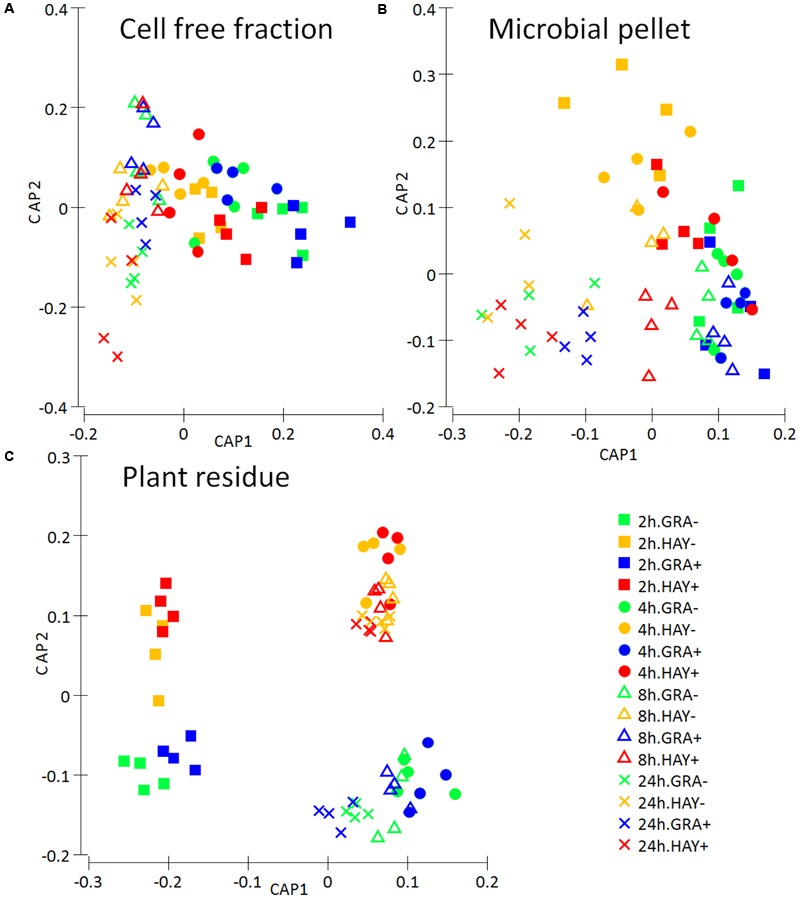
FIGURE 9.

Metabolite fingerprinting based on FTIR spectroscopy depicting the effect of the type of forage and vitamin E supplementation on the dynamics the rumen interactome in the Rusitec system: a cell free fraction (A), a microbial pellet recovered from the planktonic phase (B) and a plant residue including microorganism (C). Canonical Analysis of Principal Coordinate was performed based on Bray–Curtis dissimilarity.
