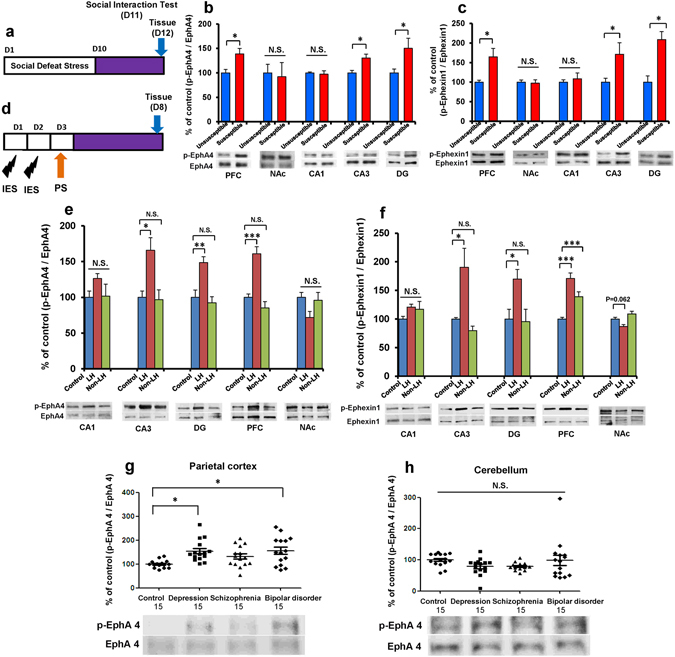
Figure 1.

p-EphA4/EphA4 and p-ephexin1/ephexin1 ratios in the brain regions of mice with the depression-like phenotype and the postmortem brains of depressed patients. (a) Schedule of social defeat stress (10 days), social interaction test and brain sample collection. (b and c) The ratios of p-EphA4/EphA4 and p-ephexin1/ephexin1 in the mouse brain regions from social defeat stress (susceptible) mice and control (unsusceptible) mice. Data represent the mean ± S.E.M. (n = 5 or 6). *P < 0.05 compared with the control group. N.S.: not significant (Student’s t-test). (d) Schedule of learned helplessness (LH) and brain sample collection. (e and f) The ratios of p-EphA4/EphA4 and p-Ephexin1/Ephexin1 in the rat brain regions from control, LH, and non-LH rats (n = 5–6). Data represent the mean ± S.E.M. *P < 0.05, **P < 0.01 and ***P < 0.01 compared with the control group. N.S.: not significant. (g and h): The ratios of p-EphA4/EphA4 in the postmortem brain samples (parietal cortex and cerebellum) from control, depression, schizophrenia, and bipolar disorder subjects. Data represent the mean ± S.E.M. (n = 15). *P < 0.05 compared with control group, N.S.: not significant.
