
Figure 6.
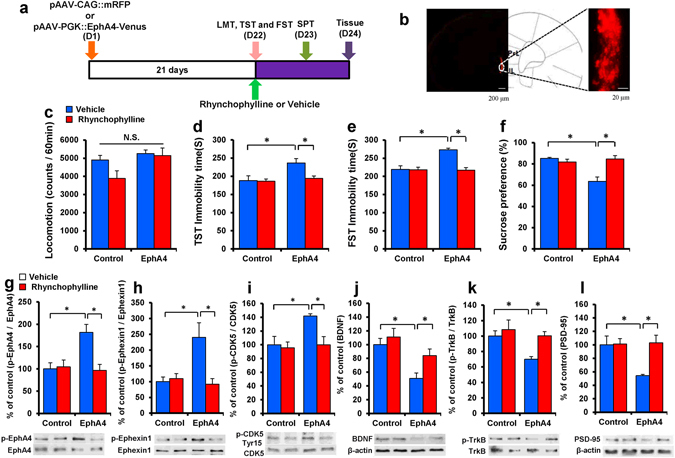
Depression-like phenotype after bilateral injection of pAAV-PGK:: EphA4-Venus into the mPFC. (a) Schedule of pAAV vector injection, drug treatment, and behavioral tests. (b) Representative photographs of the injection sites and coronal brain sections in the mPFC. The success of AAV vector injection into the mPFC was confirmed by the presence of mRFP fluorescence. Scale bars = 200 μm (low-power images) and 20 μm (high-power images). (c) LMT. (d) TST. (e) FST. (f) SPT. The values represent the mean ± S.E.M. (n = 7). *P < 0.05 compared with the vehicle + EphA4 group. N.S.: not significant. (g) p-EphA4/EphA4 ratio in the PFC. (h) p-Ephexin1/Ephexin1 ratio in the PFC. (i) p-Cdk5(Tyr15)/Cdk5 ratio in the PFC. (j) BDNF in the PFC. (k) p-TrkB/TrkB ratio in the PFC. (l) PSD-95 in the PFC. The values represent the mean ± S.E.M. (n = 5 or 6). *P < 0.05 compared with the vehicle + EphA4 group. N.S.: not significant.