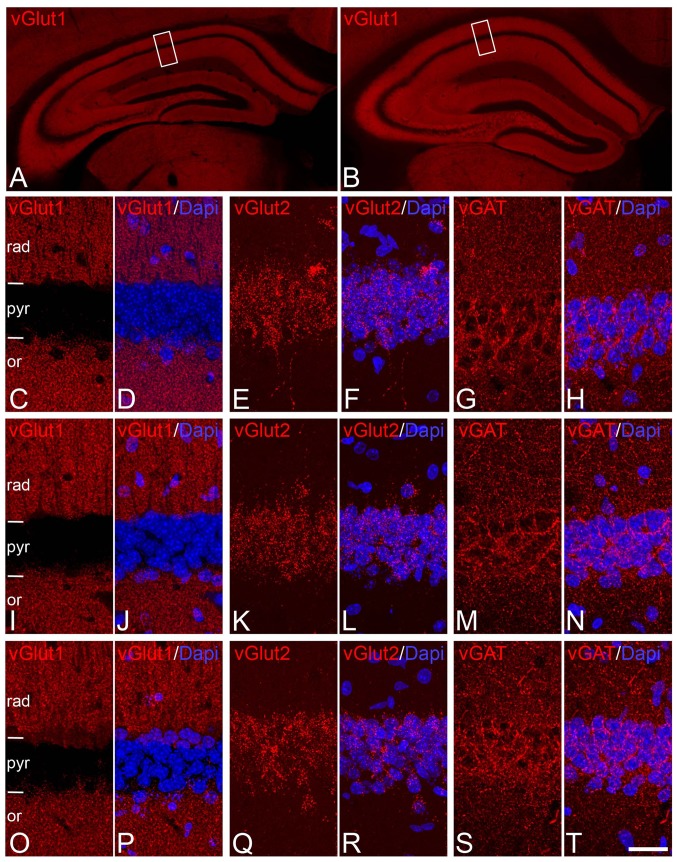
Fig. 2.
Distribution of glutamatergic axon terminals and GABAergic axon terminal immunoreactivity in the CA1 hippocampal region. a, b Low-magnification photomicrographs showing the similar distribution and intensity of immunostaining of vGLUT1 in the hippocampus of perfusion-fixed animals (a) and brains fixed by immersion after 5 h PT (b). c–t Pairs of confocal images from the CA1 region taken from sections immunostained for vGLUT1 (C,D,I,J,O,P), v-GLUT2 (E,F,F,L,Q,R), vGAT (G,H,M,N,S,T) and counterstained with DAPI from perfusion-fixed brains (c–h) or brains fixed by immersion after 30 min (i–n) or 5 h (o–t) PT. Rectangles in a and b indicate the areas of magnification in c and o, respectively. Note that vGlut1 and vGlut2 terminals distribute in a roughly complementary way in CA1. Also note the apparent absence of changes in the distribution of vGlut1, vGlut2 and vGAT between the brains fixed with different procedures and PTs. or, stratum oriens; pyr, stratum pyramidale; rad, stratum radiatum. Scale bar (in t): 400 µm in (a, b); 17 µm in (c–t)

