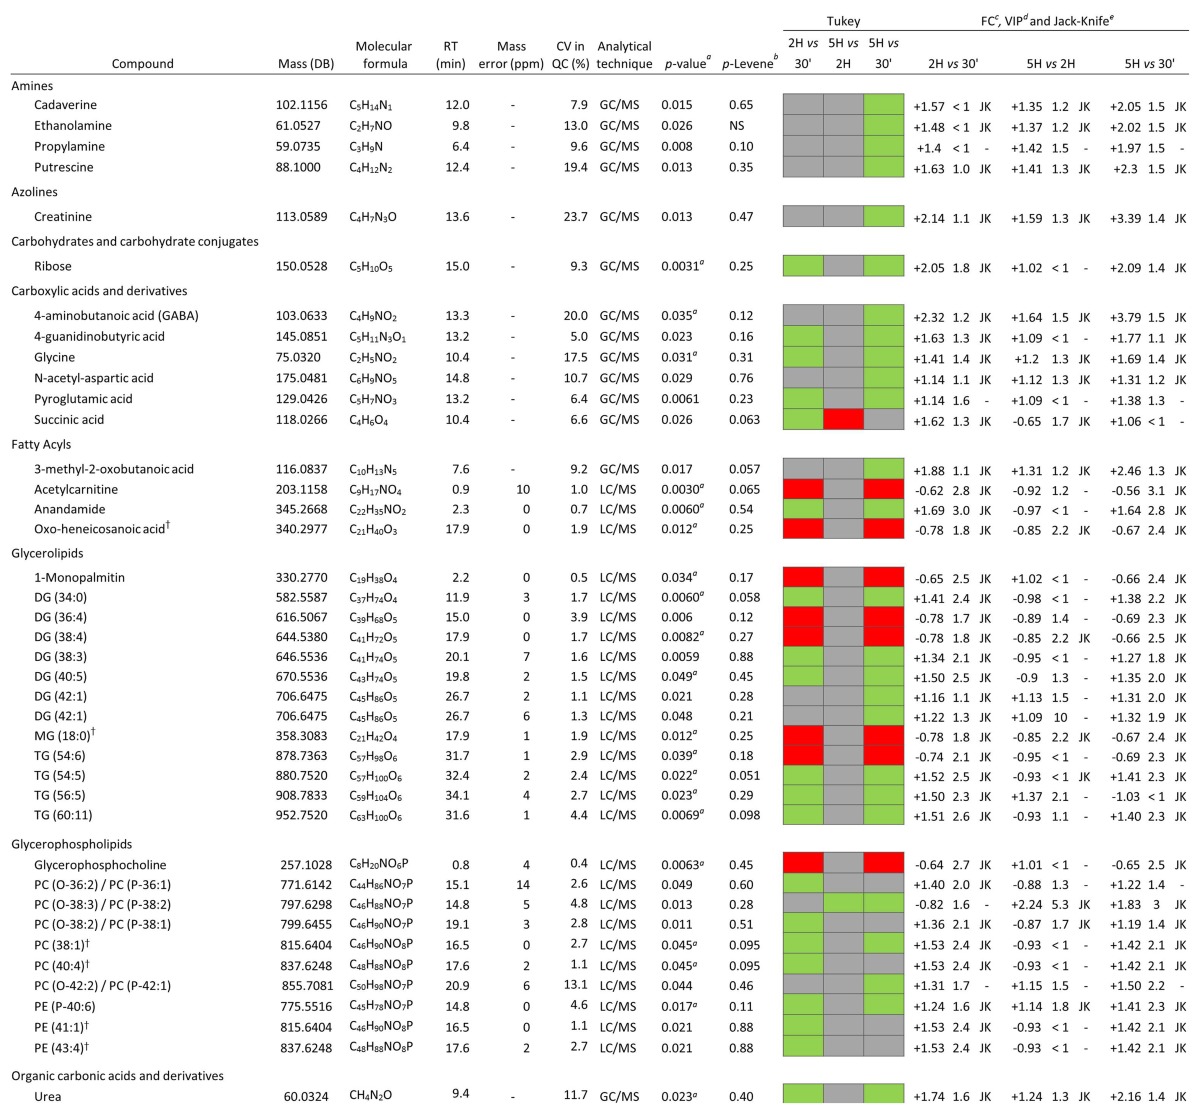
Table 1.
Metabolites that showed statistical significance any of the post-mortem comparisons at different times in hippocampus
†Alternative identification. Besides all of the metabolic changes observed in this study, it is important to take into account all the compounds found in the analysis which showed no significant alterations over time. All these metabolites are summarized in Table 2, next to a summary of all the metabolites found to be statistically significant
aCV, coefficient of variation of the metabolites in the QC samples
b p value, corrected p value by Benjamini–Hochberg test correction
c p Levene, p Levene was considered as significant at values higher than 0.05 in order to test homogeneity of variances, NS nonsignificant
dTukey’s test results colored by significance of the metabolite in the specific comparison (green means the metabolite is significant and is up-regulated, red means the metabolite is significant and is down-regulated, and gray means the metabolite is not significant)
eFC, fold change in the specified comparison; the sign indicates the direction of change
fVIP, VIP values higher than 1 were considered as significant
gJackknife confidence interval

