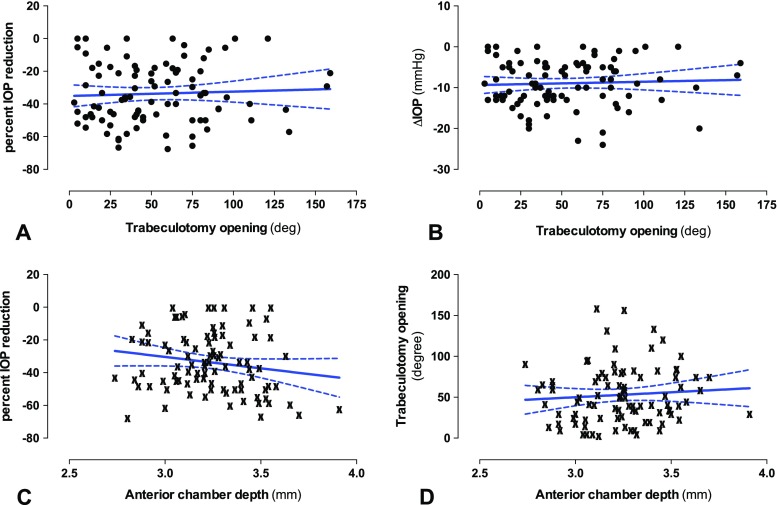
Fig. 3.
Scatterplots and linear regression analysis for TO opening (top row), ACD (bottom row) and the IOP reduction. A and B) The TO opening was plotted against the percent IOP reduction (A) or ΔIOP (B). For both cases, the linear regression showed a slope close to zero. C and D) ACD plotted against the percent IOP reduction (C) or the TO opening (D). For higher ACD values, the linear regression line showed a tendency towards better IOP reduction (C) or larger TO opening (D). However, the 95% confidence interval included zero in both cases, which indicates the absence of a linear relationship between the variables

