Figure 3.

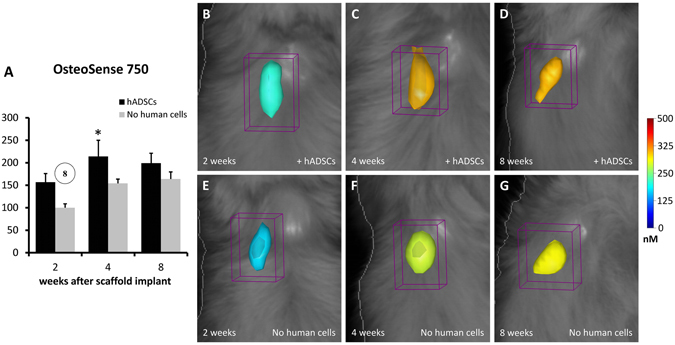
FMT images and in vivo quantification of osteogenesis within the implanted scaffolds. The color scale indicates the mean fluorescent probe concentrations within the ROI, and the graph (A) shows the mean values of probe content (in pmol) calculated within groups and reported as percent of the mean value of the 2 wk group with cell-free scaffold. It is evident that a higher concentration of probe (OsteoSense 750) is present when the scaffolds contain hADSCs, at all time-points (B–D) when compared with cell-free scaffolds (E–G). In the graph A, the number into the circle indicates significant difference (P < 0.05) from the corresponding time-point, in weeks (same treatment group). The asterisk indicates significant difference (P < 0.05) from the other treatment group (same time-point).
