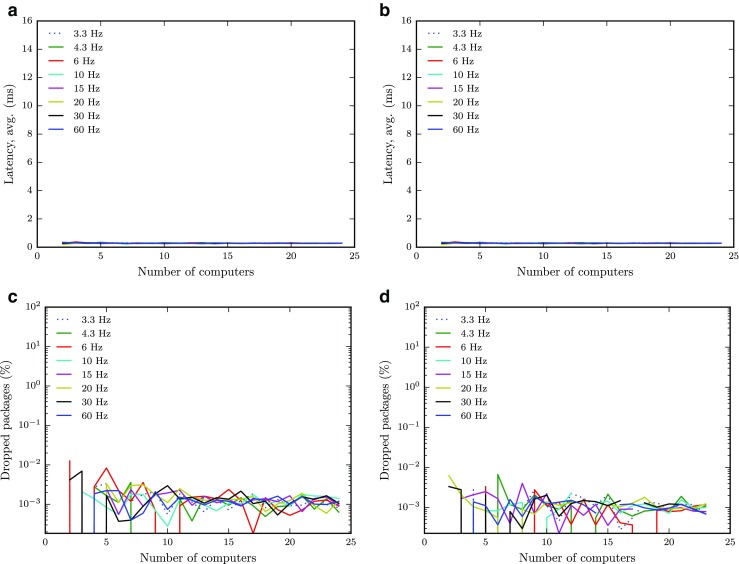
Fig. 11.

Results reproduced with the wired setup. Mean latency (first row) and proportion of dropped packages (second row) as a function of the number of clients for each data rate (3.3 → 60 Hz, see legend). Results without (first column) and with (second column) the eye tracker running are included
