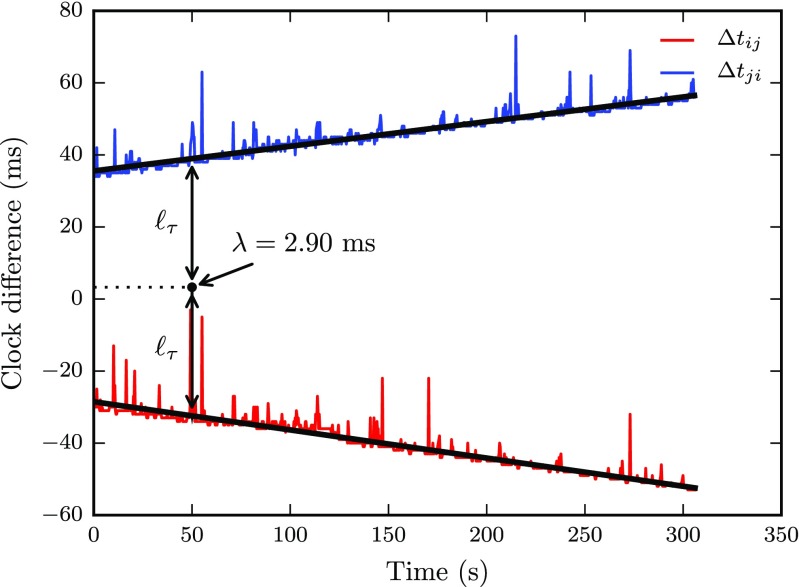
Fig. 5.
Time from a packet is sent from client i until it arrived to client j, Δt ij (red) and vice versa, Δt ji (blue). Black lines represent robust linear fits of the data. All timestamps represent differences between local clock times. The lines are symmetric around the estimated latency, λ. The differences are not constant over time since the clocks drift relative to each other. The clock offset at time τ is represented by ℓ τ. The data were recorded in a run with five clients sending data at a rate of 3.33 Hz

