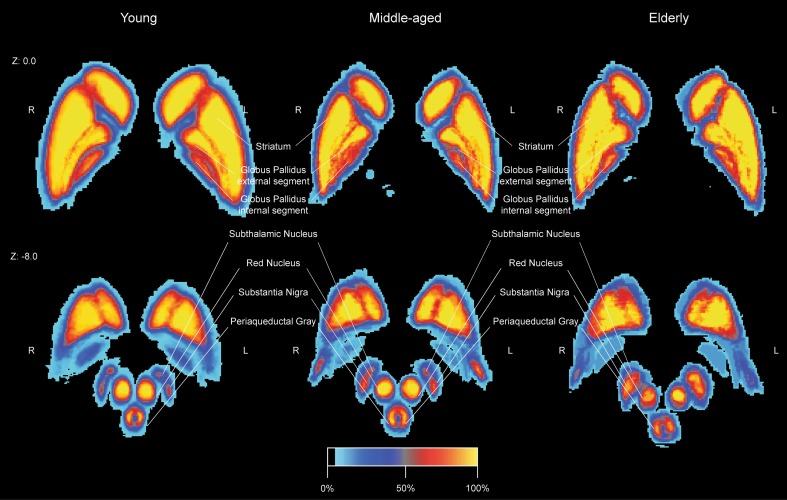
Fig. 6.
The linearly registered probability atlas in MNI-space per age group. The colour intensity reflects the percentage overlap across the participants per age group. A 100% overlap for the young indicates that 30 participants shared that voxel, whereas a 100% overlap for the elderly indicates that nine participants shared that voxel

