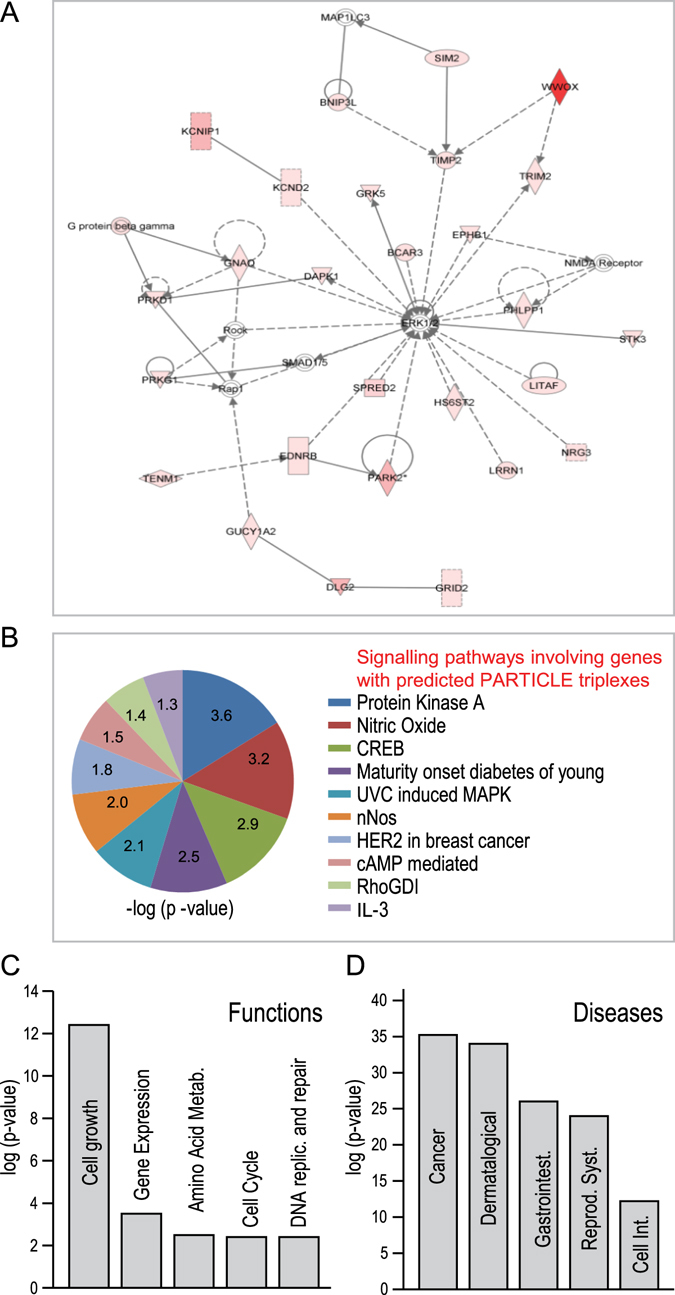
Figure 5.

Ingenuity® Analysis™ software (www.ingenuity.com) used in the analysis of genes with predicted PARTICLE triplex binding sites (Fig. S1 Triplex Domain Finder) associated with signaling pathways, molecular functions and diseases. (A) Graphical representation of genes with predicted PARTICLE triplex binding sites (pink) associated with the ERK 1/2 regulatory network. The predominance of triplexes within WWOX is shown in red. (B–D) Significantly associated signaling pathways (B), molecular functions (C) and diseases (D) involving genes with predicted PARTICLE triplexes. Pie chart (B) or histograms (C,D) of associated –log of the calculated p-value whereby a significant p value of p < 0.05 is equivalent to −log = 1.3.
