
Figure 2.
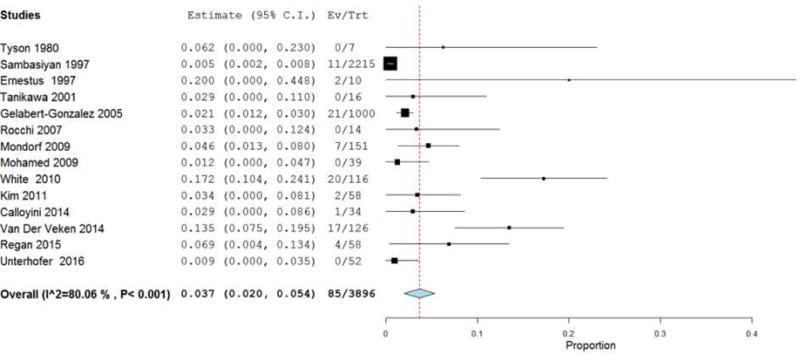
Forest plot demonstrating a 3.7% overall mortality rate with each line representing the 95% confidence interval. Boxes represent mortality rates in that study with its size correlating to the study’s effect size.
Official websites use .gov
A
.gov website belongs to an official
government organization in the United States.
Secure .gov websites use HTTPS
A lock (
) or https:// means you've safely
connected to the .gov website. Share sensitive
information only on official, secure websites.
Forest plot demonstrating a 3.7% overall mortality rate with each line representing the 95% confidence interval. Boxes represent mortality rates in that study with its size correlating to the study’s effect size.