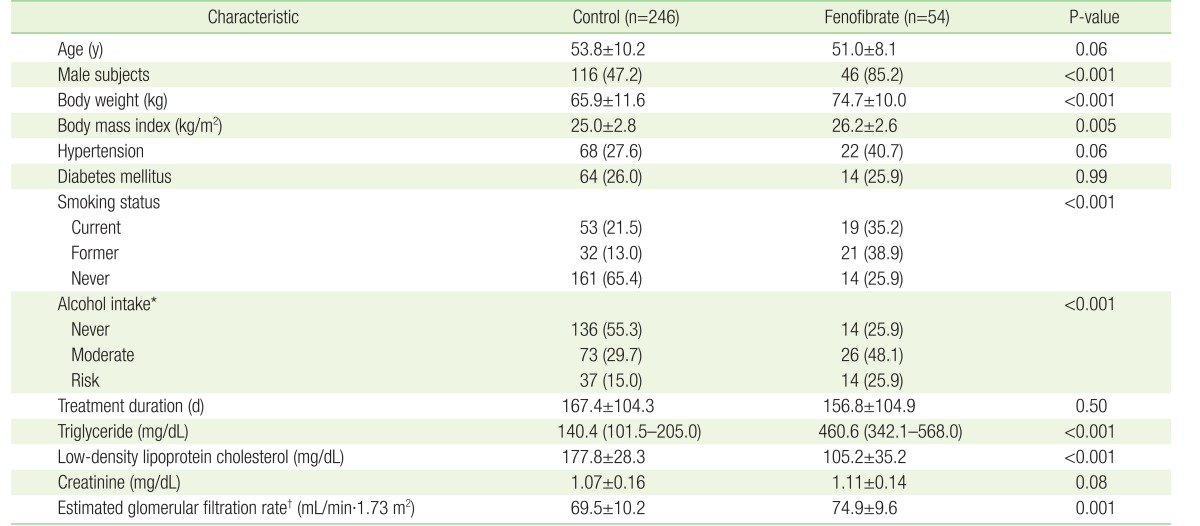
Table 1. Baseline characteristics of study subjects before propensity score matching.
Values are presented as mean±standard deviation or number (%), with the exception of triglyceride levels, which are presented as the median and the interquartile range.
Continuous variables were analyzed using the t-test and categorical variables were analyzed using the chi-square test.
*Never, non-drinker, and moderate alcohol intake ≤14 units and ≤7 units per week for male and female subjects, respectively; risk alcohol intake ≥15 units and ≥8 units per week for male and female subjects, respectively. †Calculated using the Chronic Kidney Disease Epidemiology Collaboration guidelines.

