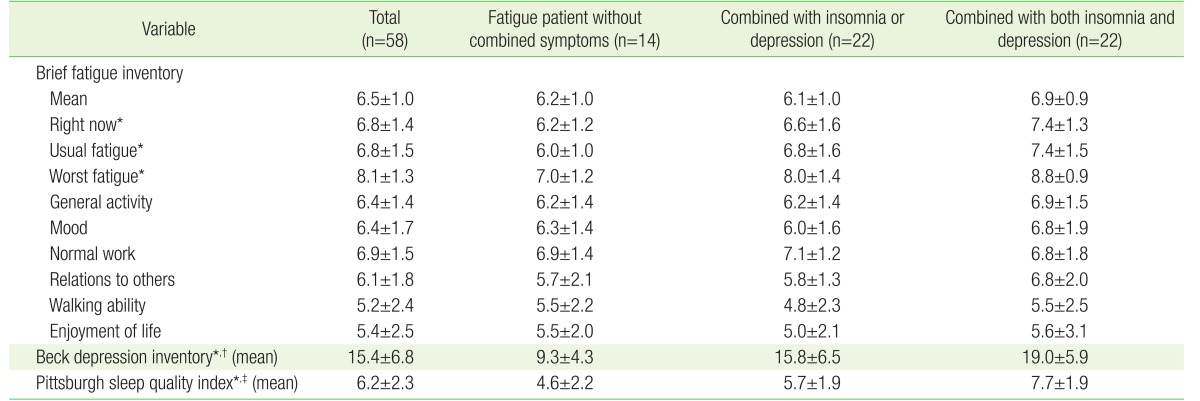
Table 2. Distribution of fatigue, depression, and sleep quality according to study groups.
Values are presented as mean±standard deviation.
*P-value <0.05 between group without combined symptom and group with both insomnia and depression. †P-value <0.05 between group without combined symptom and group with one of the combined symptoms. ‡P-value <0.05 between group with one of the combined symptoms and with both insomnia and depression.

