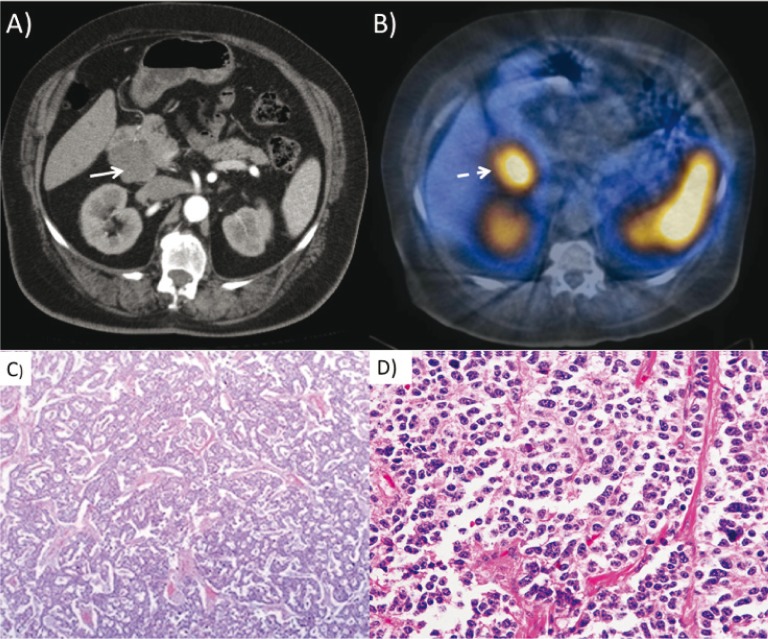
Figure 4.
(A) Axial CT images of the abdomen with contrast show a mass in the head of the pancreas (white arrow) in a patient with abnormal gastrin levels clinically. (B) SPECT-CT images of a patient after administration of In-111-octreoscan show abnormal uptake in the pancreatic head mass (dashed white arrow). (C) Low-power- and (D) high-power-hematoxylin-eosin staining showing uniform neuroendocrine cells.

