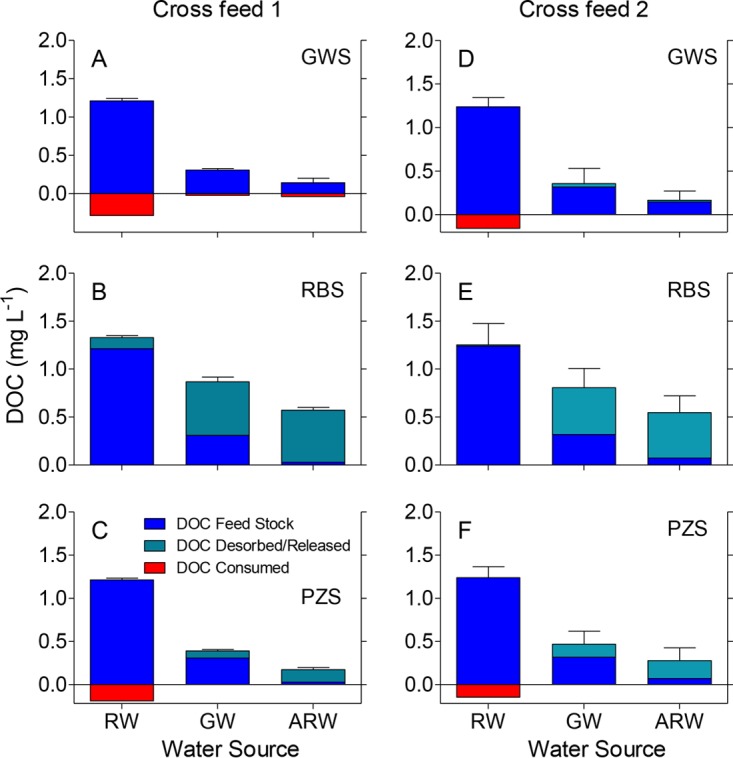
FIG 3.

DOC concentrations in the fluid phase of groundwater (A, D), riverbed (B, E), and piezometer (C, F) sand reactors from the two replicate cross-feed experiments. The green and red sections show the release or consumption of DOC based on the difference between the reactor DOC and the expected DOC content of the feed stock solution (blue sections). Values are the means ± SDs from 3 time points from triplicate reactors for experiment 1, and the means ± SDs from 6 time points from triplicate reactors for experiment 2.
