Figure 1.

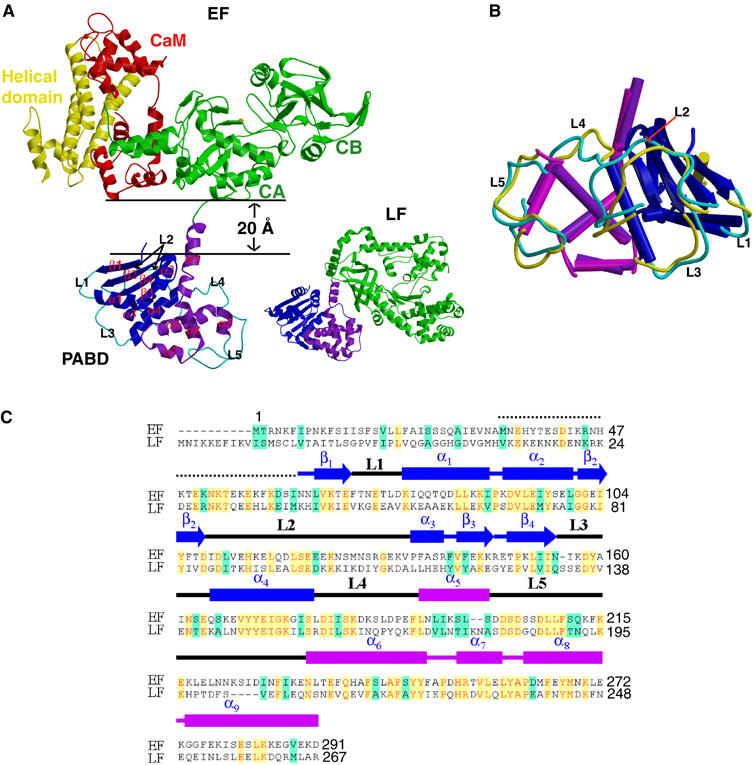
Structure of EF–CaM complex. (A) Ribbon diagram of EF in complex with CaM and that of LF. Catalytic core domain, helical domain, N-terminal PABD, and C-terminal PABD of EF are colored in green, yellow, blue, and purple, respectively, and CaM in red. N-terminal PABD, C-terminal PABD, and protease domain of LF are in blue, purple and green, respectively. (B) Comparison of PABDs of EF and LF. The similar secondary structures of the N-terminal α/β sandwich of PABDs of EF and LF are depicted in blue and dark blue, respectively, and those of the C-terminal five-helix domain of PABD of EF and LF are colored in purple and magenta, respectively. Five loops, L1–L5, which have significant differences between EF-PABD and LF-PABD, are colored in cyan and yellow, respectively. (C) Sequence alignment of PABD of EF and LF. Identical sequences are colored in yellow and similar sequences are in green.
