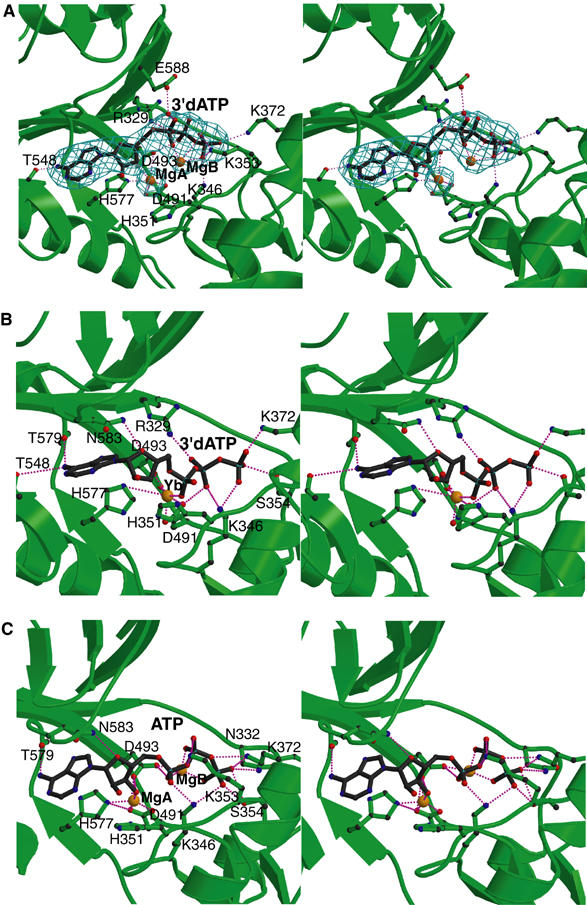
Figure 4.

The active site of EF. The comparison of active sites of EF–CaM in complex with 3′dATP (A) and the complex of EF-ACD and CaM with 3′dATP (B). The simulated annealing omit map was contoured at 3.0σ level. Oxygen, nitrogen, carbon, and metal atoms are in red, blue, black, and orange, respectively. Secondary structures of EF and ligands are in green and black, respectively. (C) The catalytic site of the simulated model based on the EF–CaM–3′dATP structure. ATP conformation and coordination of Mg2+ ions obtained from a representative snapshot along the MD trajectory of the EF–CaM–ATP complex in aqueous solution. Hydrogen atoms and water molecules are not shown.
