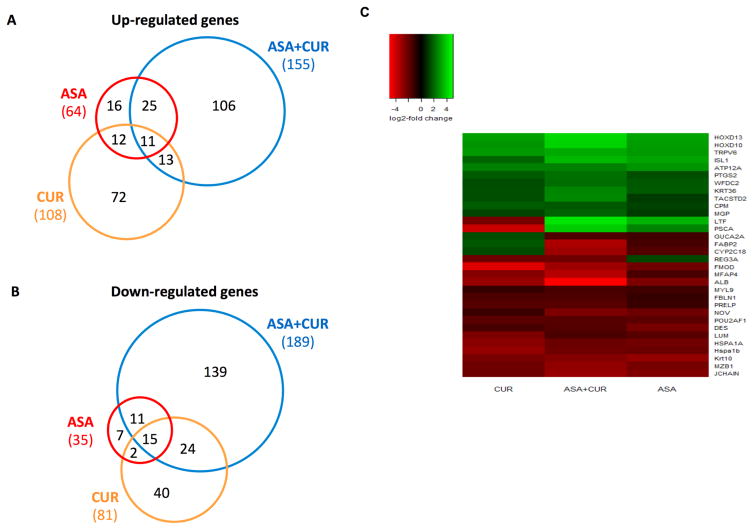
Figure 3. Overview of the genes regulated by ASA and CUR, alone or in combination, compared to the model group. (A, B).
Venn diagrams comparing the number of up-regulated genes (A) and down-regulated genes (B) in tumors from mice treated with 0.02% ASA, 2% CUR, or 0.01% ASA+1% CUR compared to tumors from mice treated with AOM/DSS alone. Genes with log2 fold changes greater than 1 and an FDR less than 0.05 were counted. (C) Heat map of 32 genes with differential expression that appeared in all three treatment groups (ASA, CUR, and ASA+CUR) compared to the model group.

