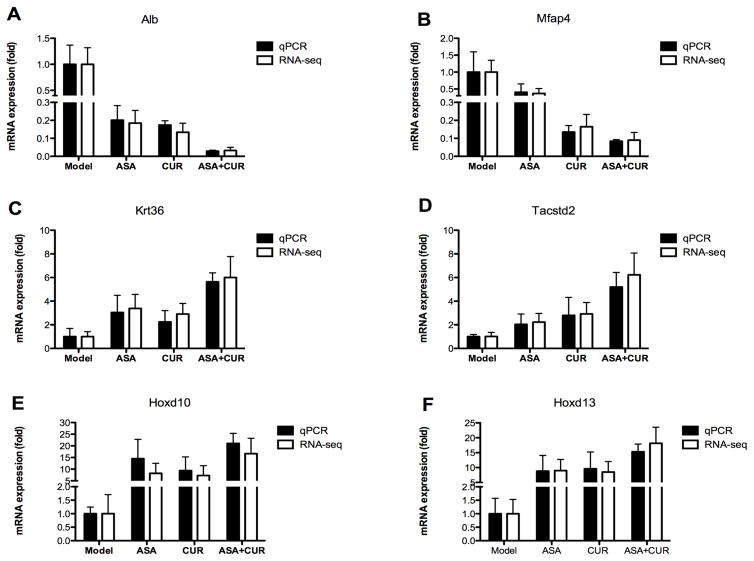
Figure 4. Validation of the mRNA expression of selected genes regulated by ASA, CUR, or their combination compared to the model group.
mRNA isolated from tumors in mice from the model, 0.02% ASA, 2% CUR, and 0.01% ASA+1% CUR groups was subjected to qPCR analysis. Black bar: the qPCR results are presented as the fold change compared with the model group using Gapdh as the endogenous control. White bar: fold change from the RNA-seq analysis. The data are presented as the mean ± SD (n = 2).

