Figure 1.

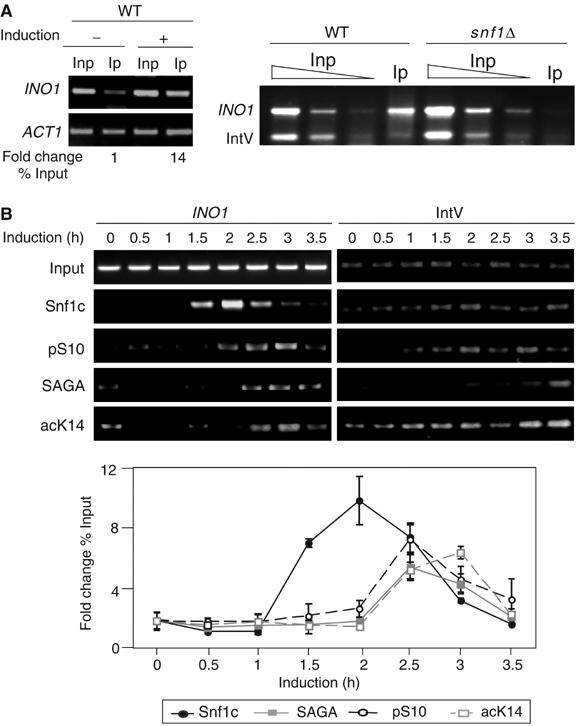
Recruitment of Snf1, SAGA, and cognate histone modifications to the INO1 promoter in vivo. (A) PCR analysis of ChIP with anti-Snf1 antibody (Snf1) on the INO1 promoter. Left panel, PCR results of ChIP-assay-performed WT cells under repressing (−, 10 μM inositol) or inducing conditions (+, inositol starvation). Inp=Input DNA and Ip=immunoprecipitated DNA by anti-Snf1. ACT1 was the internal control. See Materials and methods for quantitation methods. Right panel, PCR results of ChIP assay performed from WT compared to snf1Δ cells. Titration of input DNA (Inp) and immunoprecipitated DNA (Ip) by anti-Snf1 antibody are as indicated. Intergenic region on chromosome V (IntV) was the internal background control. (B) Time-course ChIP analysis of protein complexes and histone modifications on the INO1 promoter during induction. Cells were grown under repressing conditions to 0.8 OD600 (time 0) and then in inducing conditions at the time points indicated. Upper panel: Antibodies were against Snf1 (Snf1c), pS10, Ada2 (SAGA), and acK14. Lower panel: Quantitation of time course and statistical evaluation of multiple ChIP and PCR reactions. IntV was used as a control for ChIP.
