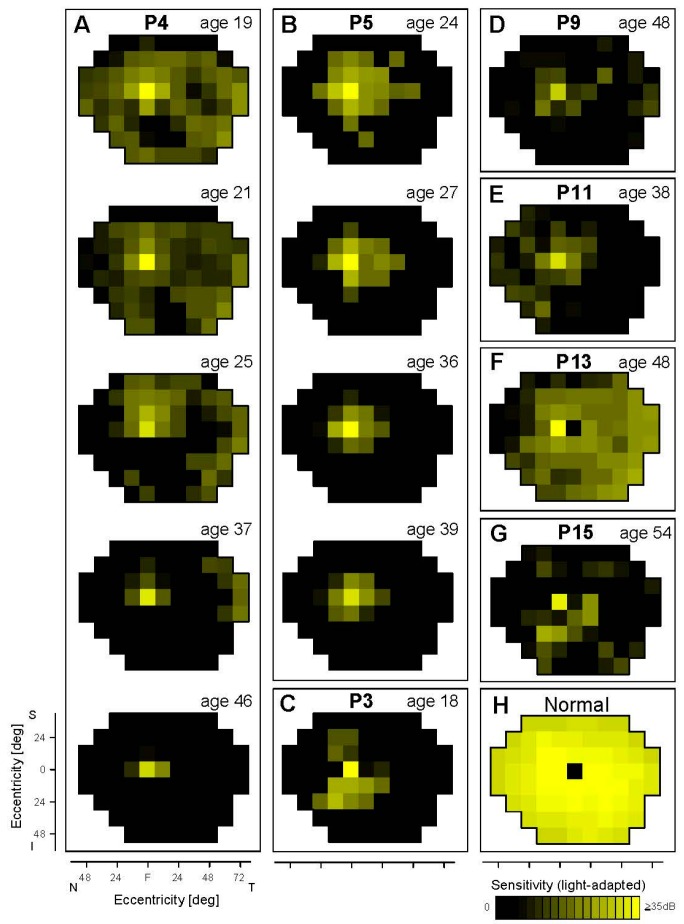
Figure 1.
Cone sensitivity across the visual field in EYS patients. Light-adapted perimetry results of seven patients are shown as maps (A–G). P4 (A) and P5 (B) have serial maps from visits spanning decades. Normal cone sensitivity is shown for reference (H). The physiological blind spot is represented as a black square at 12° in the temporal field. N, nasal; T, temporal; S, superior; I, inferior visual field.

