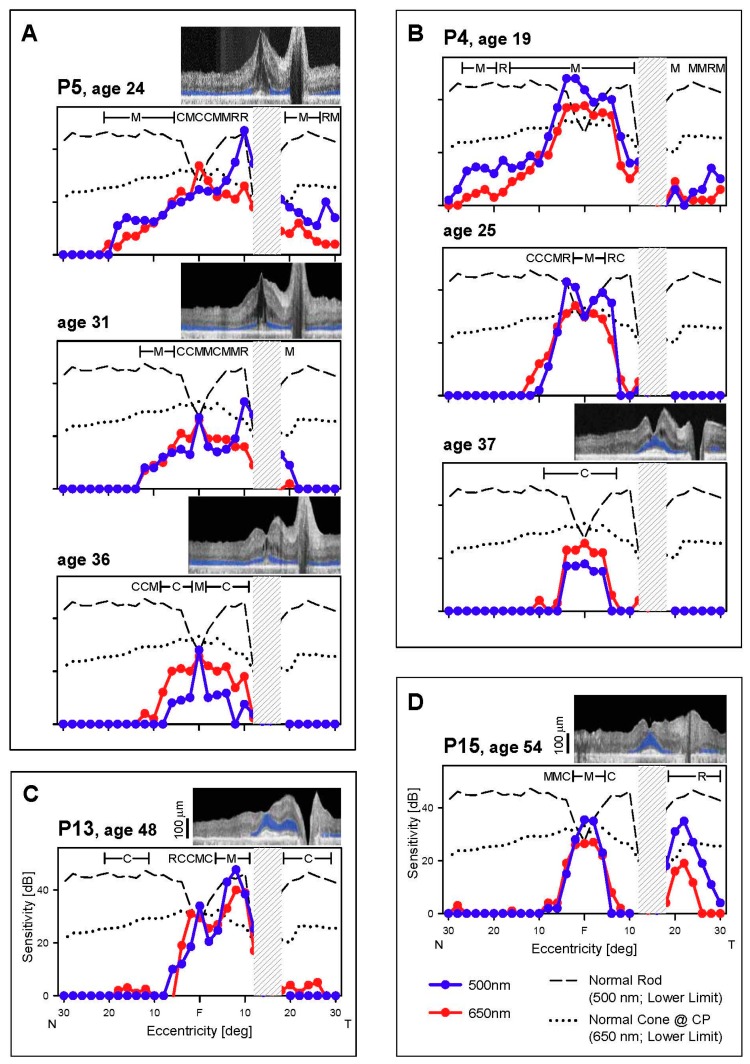
Figure 3.
Rod and cone function across the horizontal meridian. (A–D) Dark-adapted, two-color profiles measured across the central 60° in four EYS patients. All patients present with reduced rod and cone function. P5 (A) and P4 (B), the two patients with serial data, show progression of dysfunction to central islands of mainly cone function at the later visits. Hatched bar, location of physiological blindspot. Normal lower limits depicted as in Figure 2. Insets, OCTs colocalized with perimetry. F, fovea; N, nasal and T, temporal visual field.

