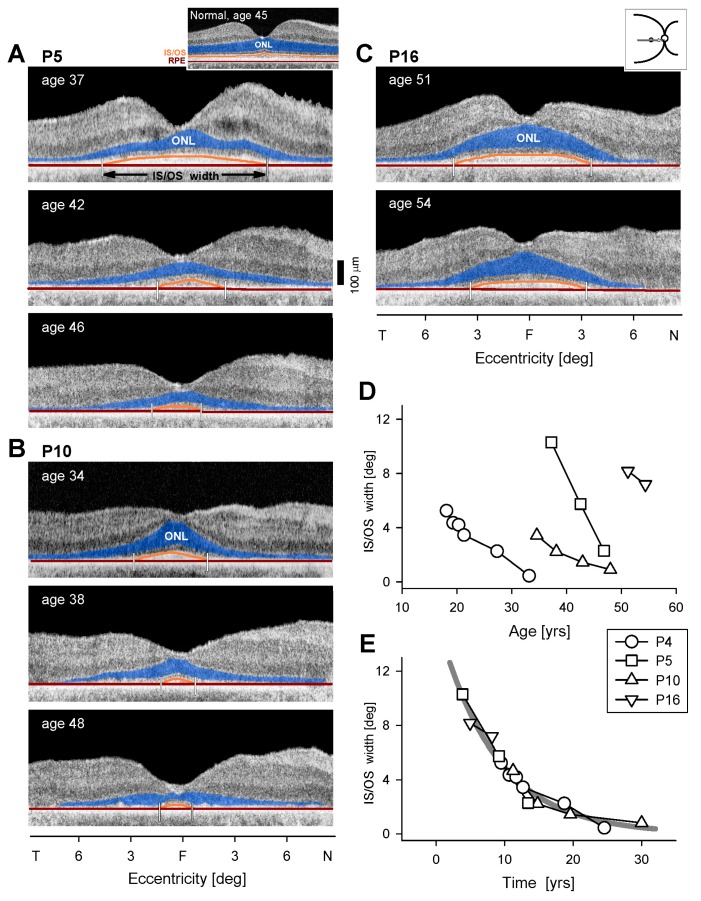
Figure 4.
Serial changes in central retinal structure in EYS. (A–C) OCT scans along the horizontal meridian through the fovea in three EYS patients. ONL is colorized in blue and proximal edges of the inner segment/outer segment (IS/OS) band and retinal pigment epithelium (RPE) used for segmentation are colored in orange and dark red, respectively. Small vertical lines mark endpoints of IS/OS width. Inset above (A) shows a normal central retina, also with colorizing of ONL, IS/OS and RPE. (D) IS/OS width plotted as a function of age for four patients; serial data connected by lines. Note: symbols in D and E are the same and identified in the key between the two graphs. (E) Longitudinal measurements of IS/OS width from each patient are shifted along the time axis to fit the model of exponential decay; the rate is 12% per year (thick gray line).

