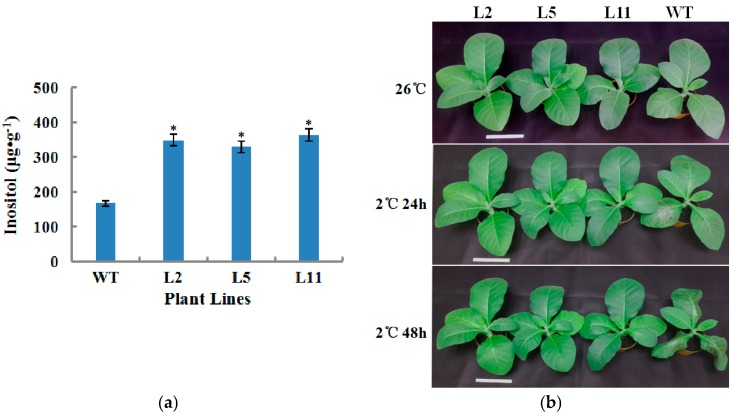
Figure 4.
OsIMP transgenic lines exhibit improved cold tolerance. (a) Measurement of inositol in the leaf of wild type (WT) and OsIMP over-expression lines (L2, L5 and L11). Data are the mean ± SE of three biological replicates; asterisks indicate significant differences (* p < 0.05, ** p < 0.01) in comparison with wild type. (b) Phenotypes of seedlings of WT and transgenic tobacco plants (L2, L5 and L11) exposed to cold stress condition (2 °C) for 48 h. The scale bar represents 10 cm.

