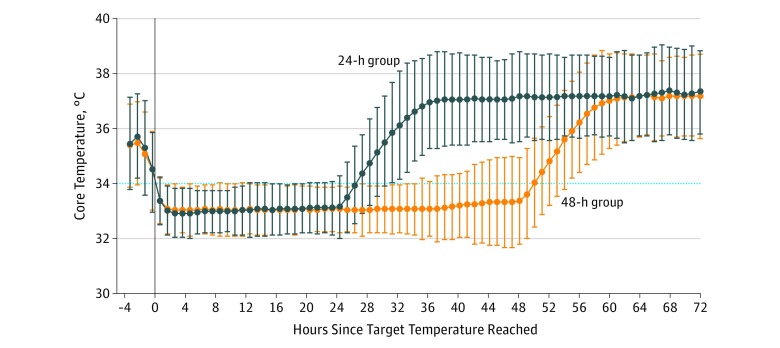
Figure 2. Core Temperature of the Intervention Groups.
Temperatures in the study groups until 72 hours after achieving target temperature (≤34°C [dotted horizontal line]), with T0 defined as the time target temperature was reached. Temperature data were available for 347 of 352 patients and were recorded with variable frequency (median, 188; interquartile range, 61-798) during the depicted period, with no statistically significant difference in frequency between groups (P = .15). Values are presented as mean ±2 SDs.

