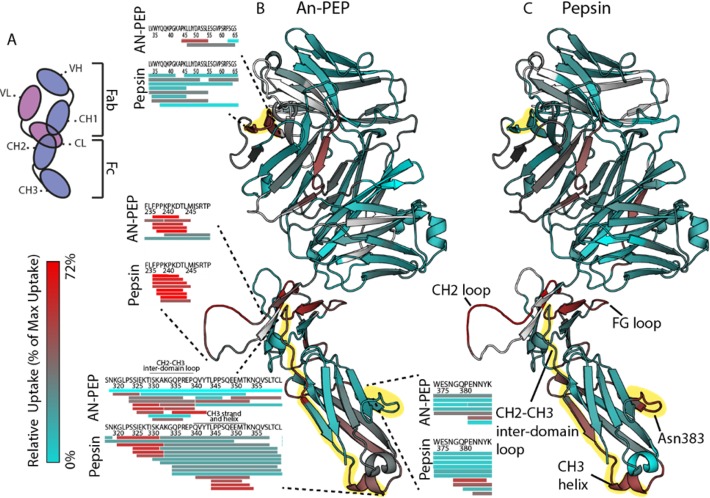
Figure 4.
Deuterium uptake data following incubation of IgG4Δhinge for 10 s in D2O mapped onto the IgG4Δhinge half body structure. Segments that show high D2O uptake are colored in red, and low uptake segments are in cyan. Protein regions that were not mapped are in white. (A) Schematic IgG4Δhinge domain representation adapted to the orientation of the molecule as presented in the figure. Light chain in pink with variable (VL) and constant (CL) domains. Heavy chain in purple with variable (VH) and constant domains (CH1–CH3). D2O uptake deduced from (B) An-PEP and (C) pepsin-derived peptides. Regions that displayed varying uptake levels are marked with segmented lines in the An-PEP map and highlighted in yellow. Insets illustrate the deuterated peptides that were identified for each region in the two digests. For simplicity of the figure, the protein regions that are discussed in detail in the text are named only in the pepsin map. The here presented IgG4Δhinge structure was modeled based on the available Pembrolizumab structure43 (PDB: 5DK3).

