
Figure 3.
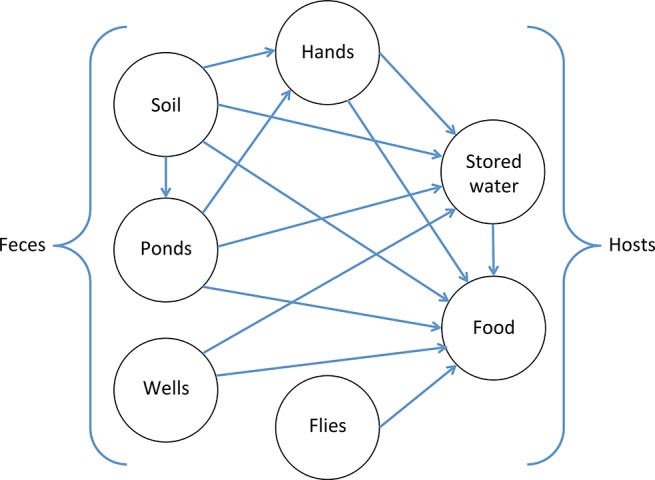
Associations between environmental transmission pathways, measured as increase in log10E. coli on a pathway associated with each log10 increase in E. coli along another pathway. Arrows indicate associations that are significant at the p < 0.05 level; the lack of an arrow between two sample types indicates that we did not observe a significant association.