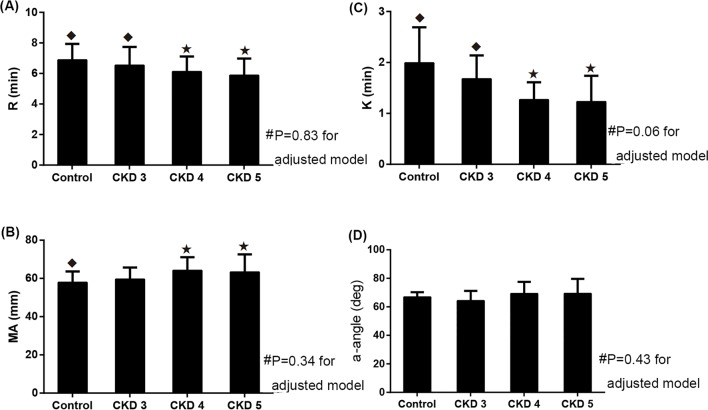
Figure 2.
TEG parameters in healthy controls and patients with CKD. (A) R value. (B) K value. (C) MA value. (D) α-angle value. #p Values for the adjusted model. Data are adjusted for age, sex, history of diabetes, history of CHD, smoking status, MAP, BMI, haemoglobin, serum albumin, cholesterol, triglyceride and UACR. *p<0.05 versus control group for unadjusted values; ◆p<0.05 versus CKD 5 group for unadjusted values. BMI, body mass index; CHD, coronary heart disease; CKD, chronic kidney disease; MA, maximum amplitude; MAP, mean arterial pressure; TEG, thromboelastography; UACR, urinary albumin to creatinine ratio.

