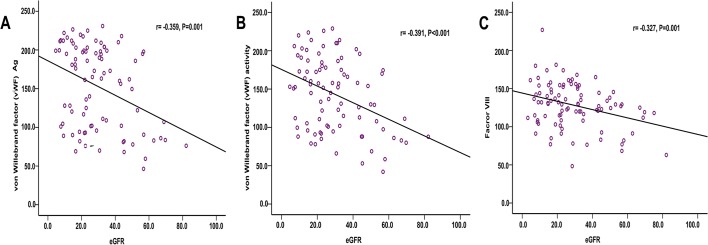
Figure 3.
Correlation of vWF:Ag, vWF:RCo and FVIII levels with eGFR. (A) Correlation of vWF:Ag with eGFR. (B) Correlation of vWF:RCo with eGFR. (C) Correlation of FVIII with eGFR. Regression lines: (A) vWF:Ag=186.3−1.12×eGFR. (B) vWF:RCo=174.2−1.05×eGFR. (C) FVIII=143.2−0.52×eGFR. eGFR, estimated glomerular filtration rate; FVIII, factor VIII; vWF:Ag, von Willebrand factor antigen; vWF:RCo, vWF ristocetin cofactor activity.

