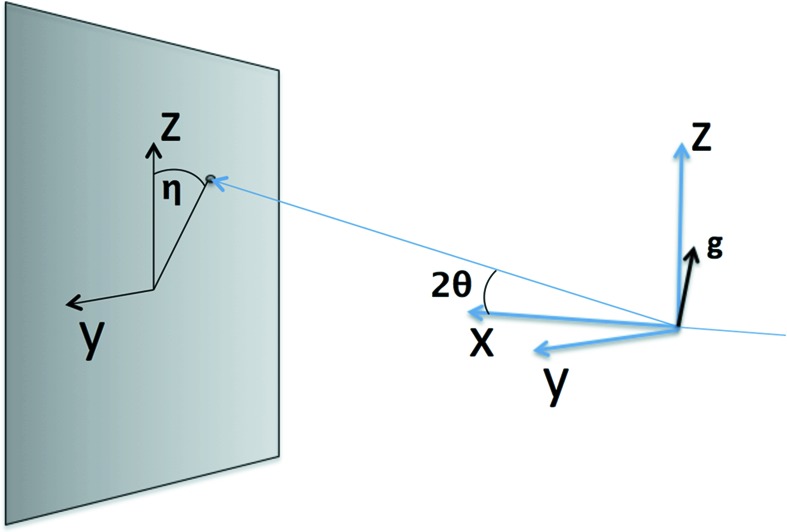
Figure 2.

Sample–detector coordinate systems in FELIX. The sample is imagined to be at the center of the xyz axis, with the beam along the x axis. The sample then scatters radiation at angles  and η onto the detector, represented as a grey plane in the illustration. The corresponding g vector is shown at the origin.
