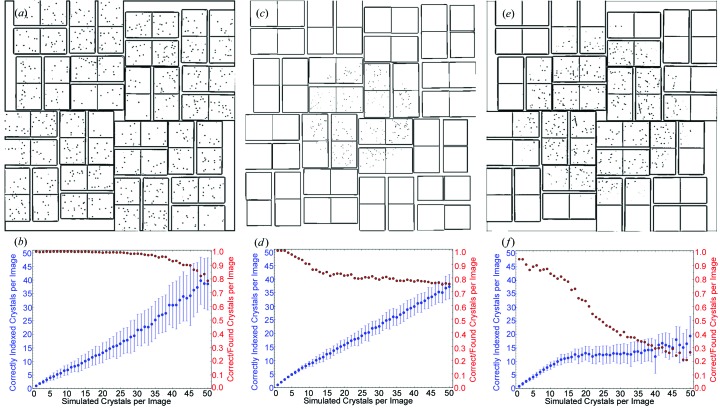
Figure 3.
(a), (c), (e) Simulated images containing diffraction patterns from five crystals each of RHO-G6, lysozyme and AT R, respectively. The spots in the images have been enlarged for the purposes of illustration. (b), (d), (f) Respective trends of the average number of correctly indexed crystals and fraction of correctly found crystals as the number of crystals in the simulated image is increased for the three aforementioned crystal systems. The error bars on the number of correctly indexed crystals depict the standard deviation of this quantity over a set of 100 independent simulations.

