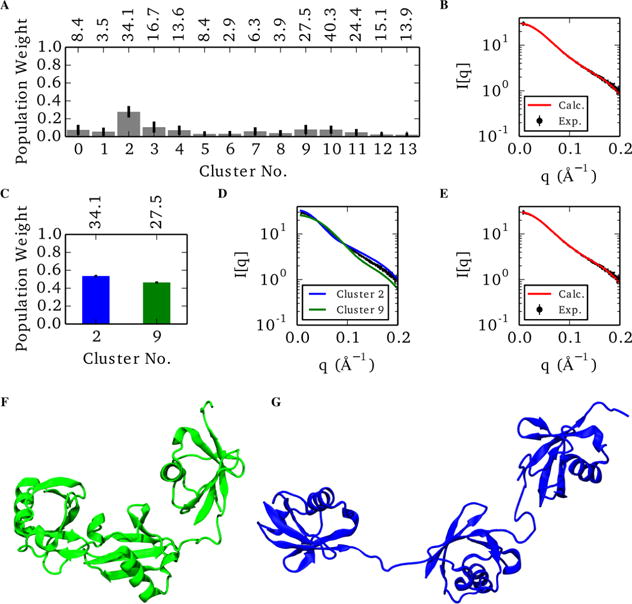
Figure 5.

Representative ensemble of the non-native K63 aMD model using the full 14-member scattering basis (A,B) and the best two-state model (C-G). (A) Populations of the individual states of the 14-member model, where error bars indicate the standard deviation of each marginal posterior distribution. Individual goodness-of-fit values are denoted above the corresponding population bar. (B) Comparison of the ensemble averaged scattering profile (red) against the experimental data (black). (C) Relative populations of the best two-state combination with individual values above the plot. (D) Individual scattering profiles of each state. (E) Ensemble-averaged scattering of the two-state model compared with experimental data. (F) Representative member of the compacted cluster. (G) Representative member of the extended cluster.
