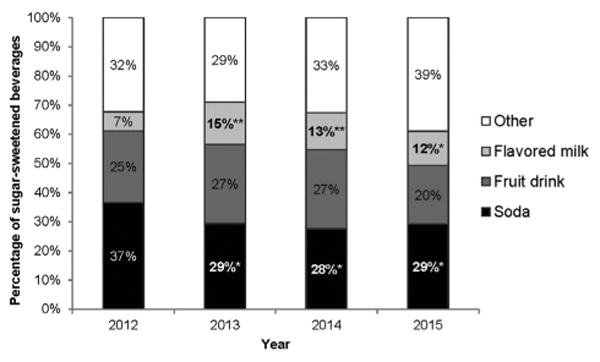
Figure 2.

Types of children's sugar-sweetened beverages available in 45 U.S. chain restaurants in 2012–2015.
Note: Figure shows the percentage of sugar-sweetened beverages (n=1,507) offered in 45 U.S. national chain restaurants in 2012–2015 that were soda, fruit drinks, flavored milks, or other sugar-sweetened beverages. *Statistically significant change from 2012 (p<0.05); **statistically significant change from 2012 (p<0.01).
