
Figure 2.
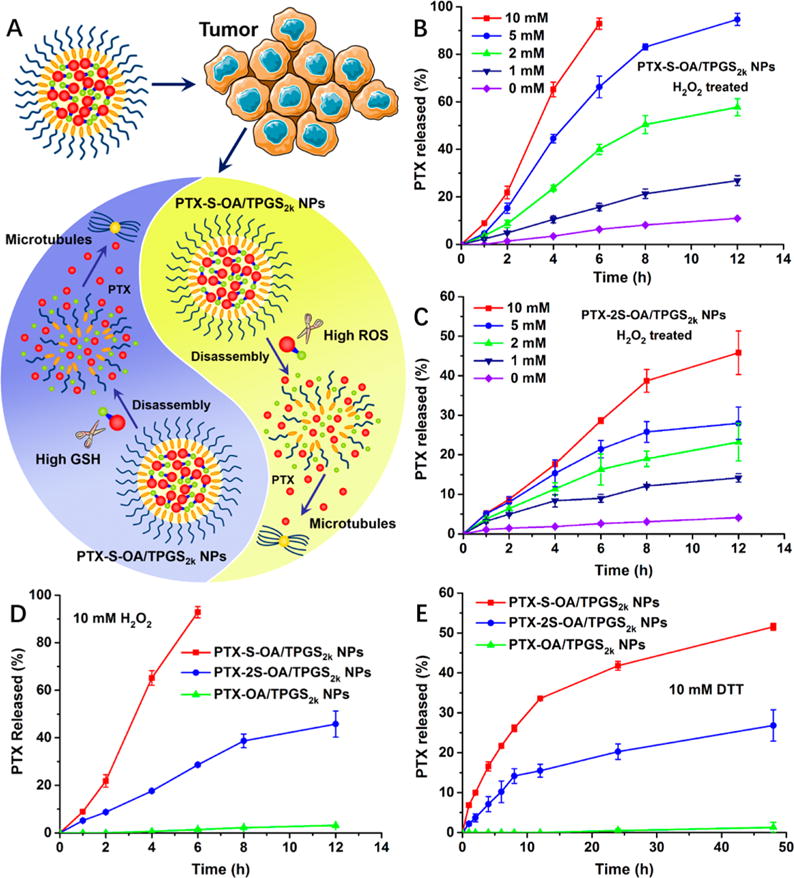
(A) Schematic representation of redox dual-responsive drug release of prodrug NPs in the presence of two opposite stimuli within tumor cells. PTX release from (B) PTX-S-OA/TPGS2k NPs and (C) PTX-2S-OA/TPGS2k NPs in the presence of various concentrations of H2O2. PTX release from PTX-S-OA/TPGS2k NPs, PTX-2S-OA/TPGS2k NPs, and PTX-OA/TPGS2k NPs in the presence of (D) 10 mM H2O2 and (E) 10 mM DTT (n = 3).