
Figure 4.
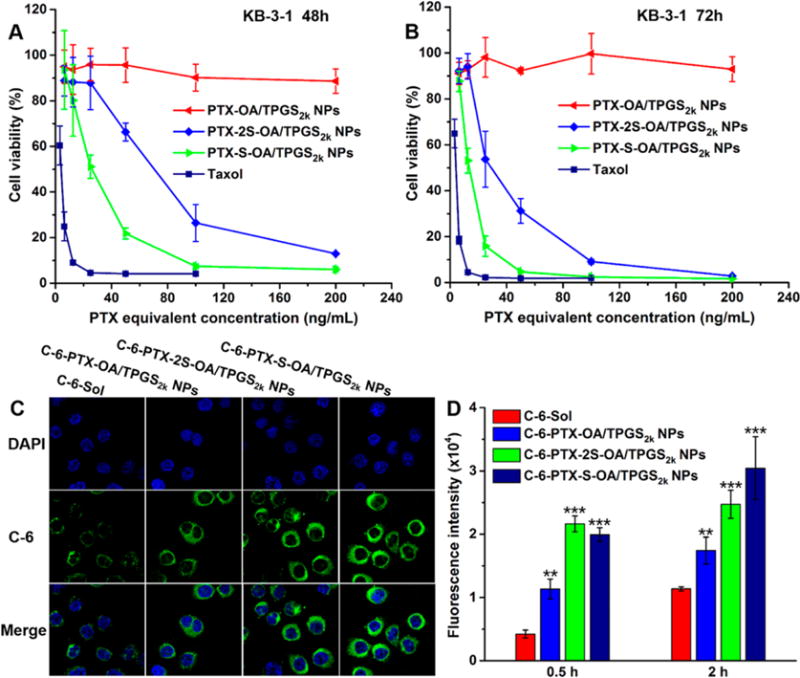
Cell viability treated with various concentrations of Taxol and prodrug NPs after (A) 48 h and (B) 72 h treatment. (C) Confocal laser scanning microscopy (CLSM) images of KB-3–1 cells incubated with free C-6 or C-6-labeled prodrug NPs for 2 h. (D) Cellular uptake in KB-3–1 cells after incubation with free C-6 or C-6-labeled prodrug NPs for 0.5 and 2 h by flow cytometry. Difference from C-6-Sol group, **P < 0.01, ***P < 0.001.